Photos
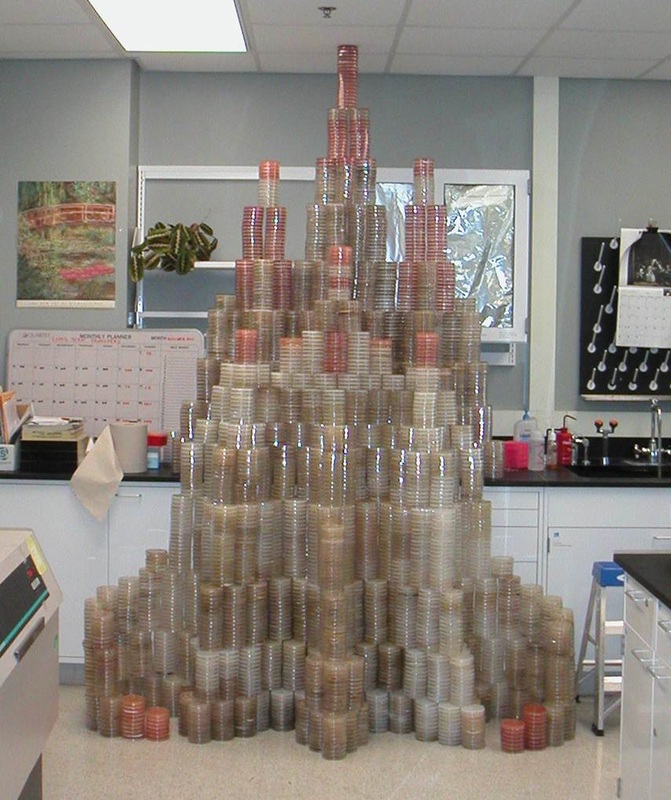
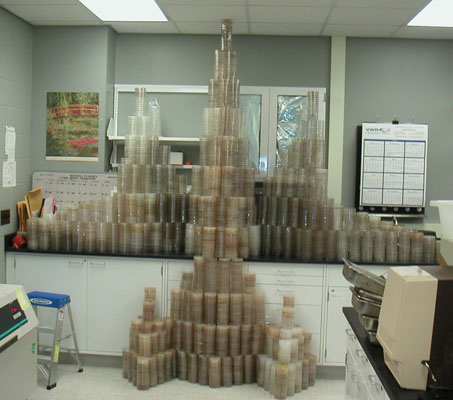
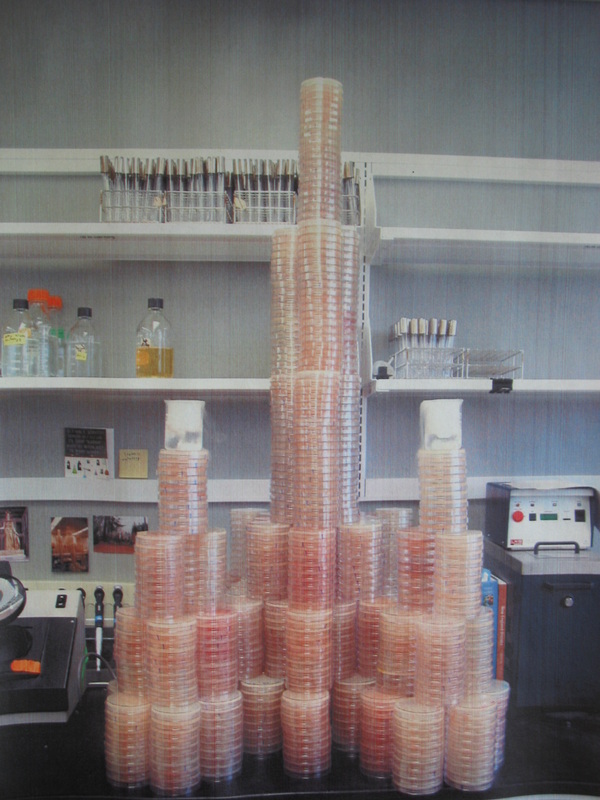
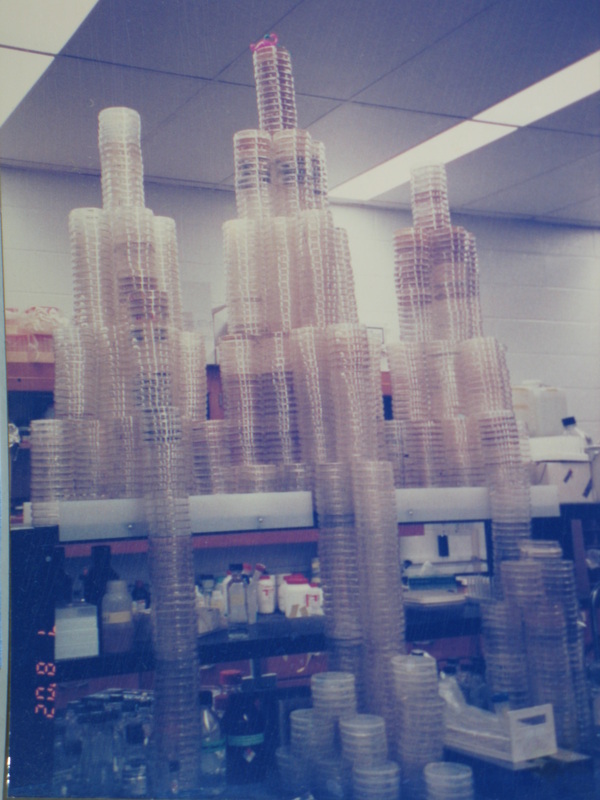
Petri Dish Towers and Other


Other Photos or Helpful Figures
I'm putting these up for people to use if they have a reason to. Just be sure to credit me when you do so. If there is some figure of some aspect of my research you would like, please get in touch and let me know. There's a chance I have one I can put up here.

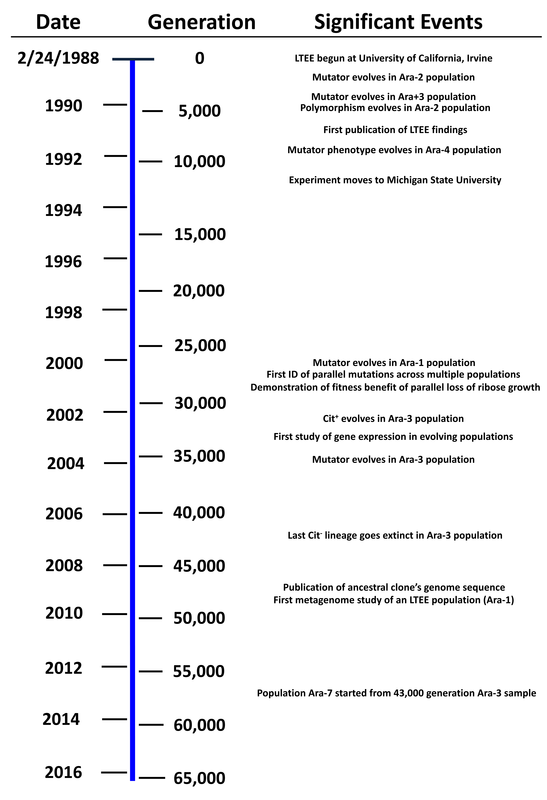
Timeline of the LTEE showing relationship between years and generations, with significant events. Copyright Zachary Blount.
Figure depicting the mutation that actualized the Cit+ trait in the Ara-3 population and its effect on expression of the citT gene.
| novel_rnk-citt_modul_and_citt_expression_figure.pdf |